Stats
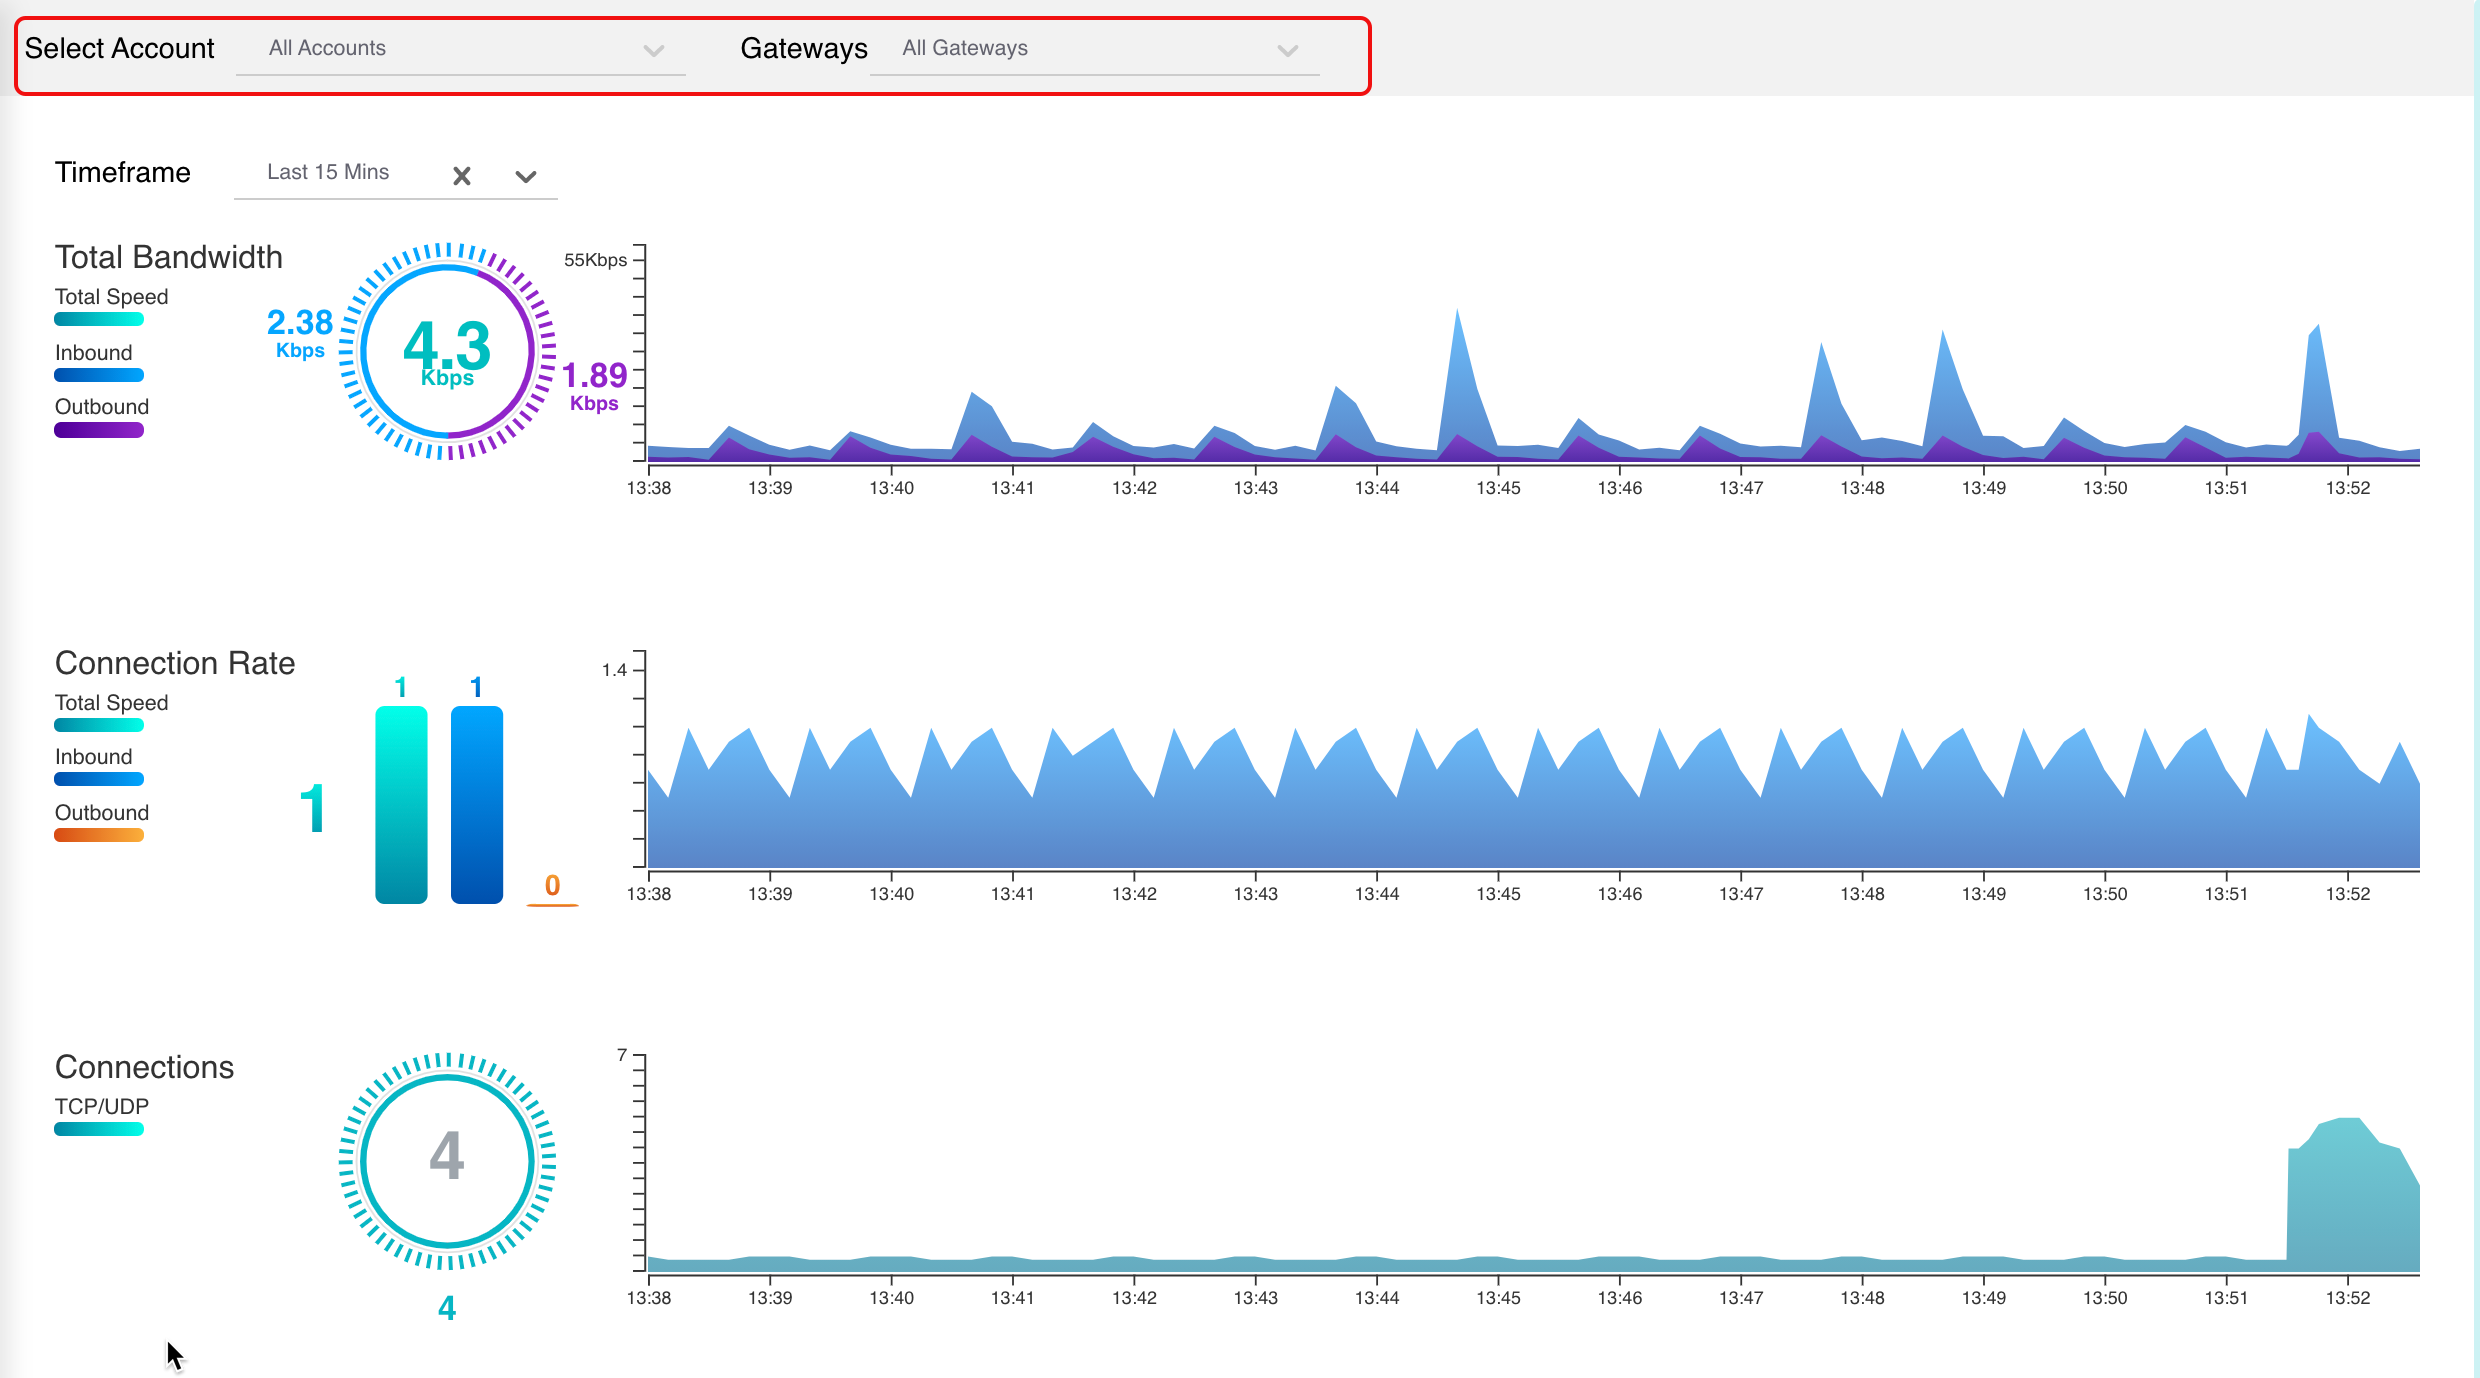
This view provides detailed visibility into the bandwidth and connections of selected Valtix gateway/s, both instantaneously, and over selected timeframes.
- Navigate to Investigate -> Network Analytics -> Stats
- Initially, statistics are displayed for
All CSP AccountsandAll Gatewayswith timeframe default toLast 1 hour. -
Graphically, the X and Y axis are auto-scaled based on timeframe selection / bandwidth, and auto-updated while viewing. Statistics are refreshed every 5 seconds while viewing this page.

-
Select a CSP Account and Gateway from the pulldown menus to filter statistics for a specific Gateway,
-
Select a Timeframe from the pulldown as shown below. Options are:
Last 15 minsLast 1 hourLast 1 dayLast 7 DaysLast 30 days
Note: Graphical chart will be refreshed with selected timeframe only. Speed dials are real-time.
Total Bandwidth
- Total Speed - Addition of Inbound and Outbound bandwidth of selected Gateway/s - reported in Kbps (kilobits per second).
- Inbound - bandwidth ingressing a Gateway/s - reported in Kbps (kilobits per second).
- Outbound - bandwidth egressing a Gateway/s - reported in Kbps (kilobits per second).
Connection Rate
- Total Speed - Addition of Inbound and Outbound bandwidth of selected Gateway/s - reported in Kbps (kilobits per second).
- Inbound - bandwidth ingressing a Gateway/s - reported in Kbps (kilobits per second).
- Outbound - bandwidth egressing a Gateway/s - reported in Kbps (kilobits per second).
Connections
- Connections - Concurrent UDP and TCP connections in the selected Gateway/s.