Flow Analytics - Overview
Flow Analytics provides overall visibility into the traffic seen, processed and protected by the Valtix Gateway. The traffic is organized into two main categories: Traffic Summary Logs and Security Events. Traffic Summary Logs provide information related to each traffic session that is being processed by the Gateways. Security Events provide information related to how the Gateway datapath is processing and protecting each traffic session.
Common to all Flow Analytics views are the following functions:
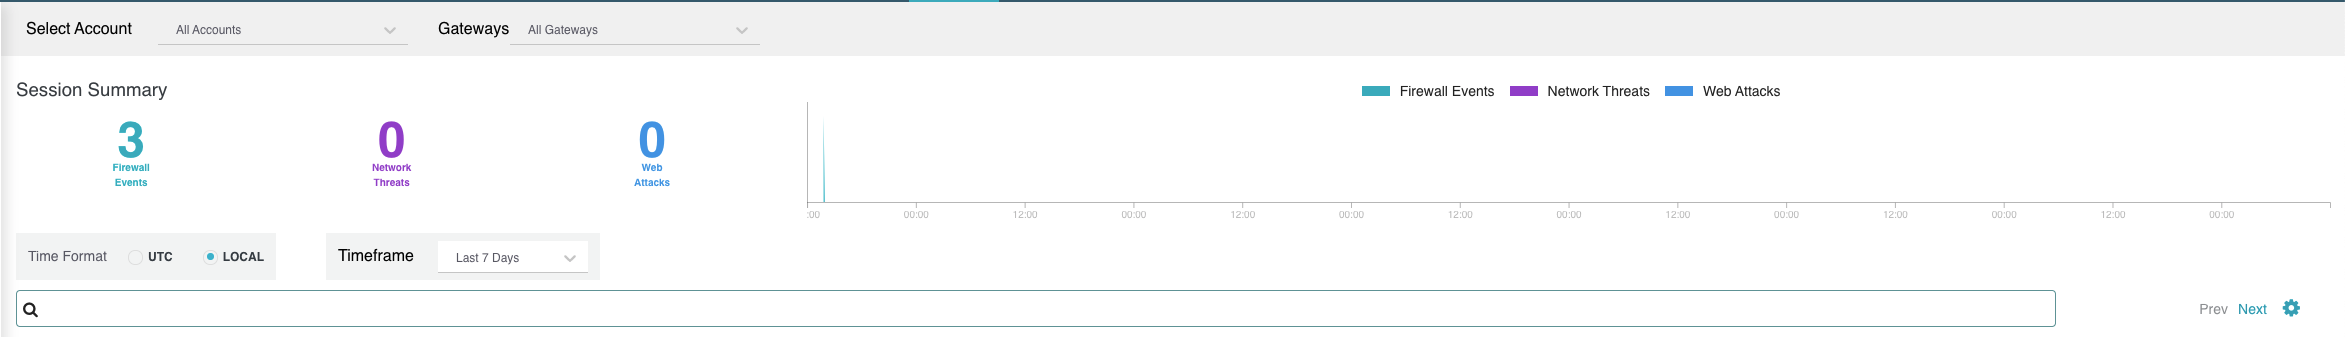
Account and Gateway Selection
-
Select a CSP Account or Gateway from the pulldown menus to filter the events. If no selection is made, then events will be shown across all CSP Accounts and Gateways.
-
Graphically, events are categorized into three (3) types:
Firewall Events,Network EventsandWeb Attacks, with a quantity detailing the event rate - (total events/selected timeframe). The X and Y axis are auto-scaled based on timeframe selection / detected events, and auto-updated while viewing.
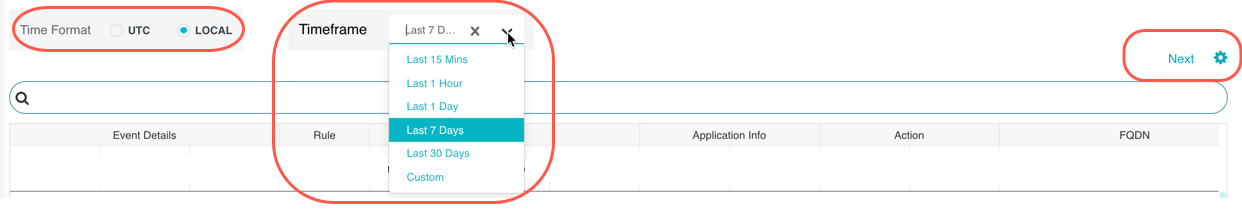
Time Format, Timeframe, Pagination
- Time Format - Select between UTC (Coordinated Universal Time) or Local time format using the radio buttons shown below. Time format displayed is ISO 8601 (Complete date plus hours, minutes, seconds and a decimal fraction of a second - YYYY-MM-DD T HH:MM:SS:S). Example: 2020-11-22T10:58:46.820.
- Timeframe - Events can be displayed in increment options from 15 minutes to 30 days, or Custom timeframes. To select, or switch between, timeframes, click the pulldown and select timeframe as shown below. For Custom timeframes, select Custom, the Start/End date and Start/End time by clicking the calender objects followed by Save.
-
Pagination - If results exceed a single page, Next will be displayed on the far right as shown below. Click Prev and Next to navigates pages.
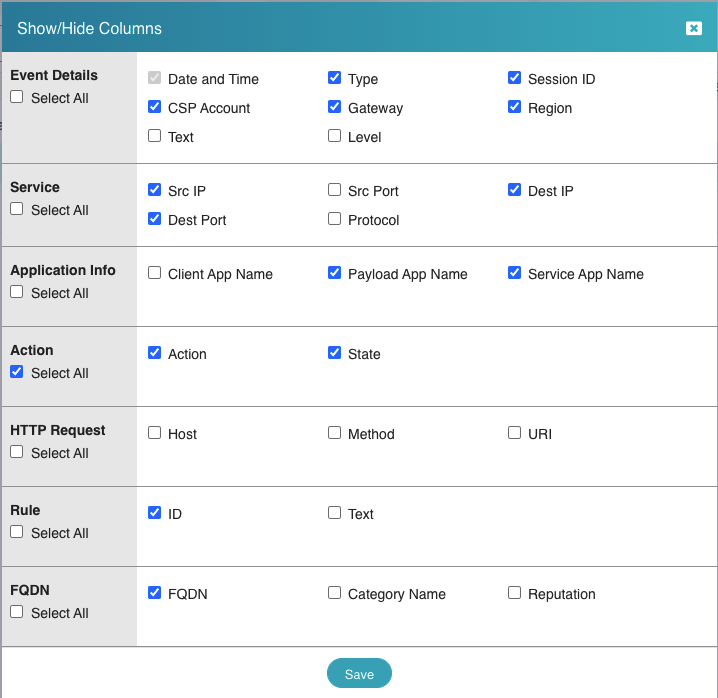
Show/Hide Columns
-
Select the "cog wheel" shown above (far right) to show/hide columns. Example shown from All Events view.
-
Using the checkboxes, add or remove columns as desired in the event layout.
- Click Save to make the changes persistent across login/logout cycles.
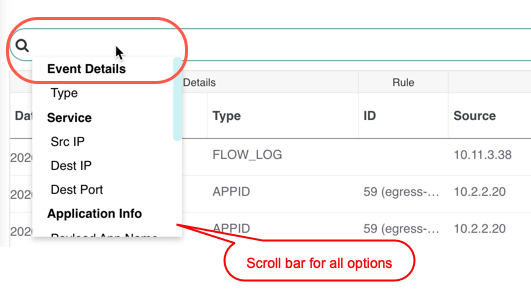
Search and Filter
Events can be filtered using the Search function which operate on the Event fields as follows. Example shown from All Events view.
To filter Events on one, or multiple, field/s:
-
Left mouse-click in the Search field to access the pull down menu. Example shown from All Events view.
-
Select a field from a category e.g.
Type(Event Details), enter a desired search value string e.g.APPIDfollowed byReturn. - Add additional Category/fields to the search criteria as required, repeating the step above.
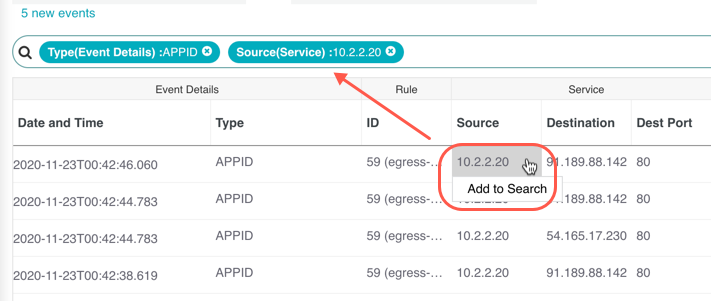
- Additional search fields can also be added by using a left mouse click anywhere on an event column/value, and selecting "Add to Search". This has the advantage of adding both the search field/category and value string in a single action.
- Free text search is also supported. Type into the search bar and
Return. If multiple free text search terms are specified, any event matching at least one of them will be displayed. Free text search terms can be used along with filtering selections. Events will be returned that match at least one of the free text search terms and all selected filters. -
Search filters are persistent across different views e.g. after selecting a desired set of filters, moving to another view will retain the selection. Moving away from the Investigate menu will clear the Search filters. It is recommended to open a new tab in the browser should you wish to perform another action while "holding" the filtered event view.
Example Result View
An example filter from All Event view for Event Type(Event Details) = "APPID" and Source(Service) = "10.2.2.20" in the filter criteria produces results as shown:
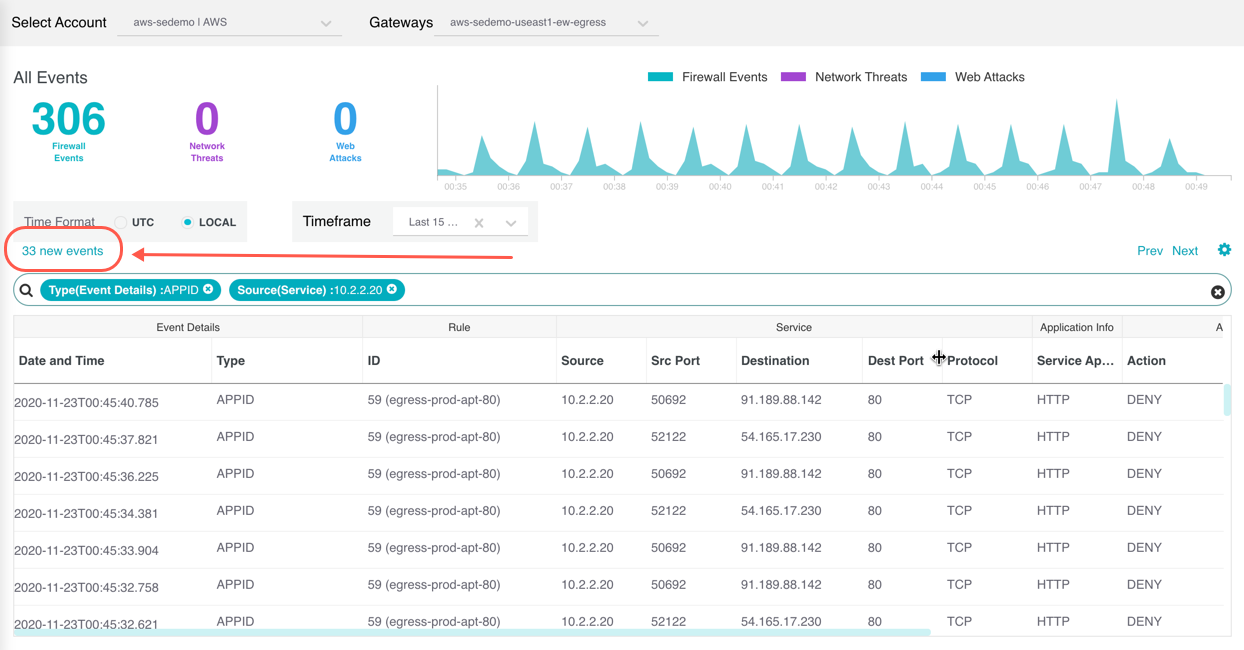
New Events / Refresh
The Flow Analytics views are updated when first viewed. New events will increment while viewing the page as shown above. Click the same to view the new events in the table.